
Use Case - ESG and Climate Insights Application
Problem:
Moody’s Analysts are diversified globally, teams depend largely on centralized databases, and dated or inadequate - but accurate - methods to implement calculations, ie: Excel documents with custom extensions.
This way of working opens the opportunity for users (Analysts) to go out of their way to create custom files and calculations when needed bypassing the approval process.
The goal
To identify custom created tools - and their data, to assess their current usage and then convert these tools into a web platform that brings this data into a series of tools that end up feeding a larger ecosystem of scorecards.
The final goal for this project, is to create the first in class and most relevant ESG (Environmental, Social, Governance) tool in the market at the time, which incorporates all this data for internal use.
Task:
As the Principal Product designer, tasked to innovate and speed the process of custom designing a series of new internal applications (Scorecards) to replace the Excel documents that Moody’s analysts were currently using. Incorporating data outputs that visualize, create, save, edit, display and present methodologies to Analyst’s teams, so they are able to save, date stamp and export to platforms for approval, all within one tool.
The method for the ESG Hub was a bit different. The Hub is a conglomerate of various applications that had to be custom analyzed on the spot and data displayed as well. - see below.
Process:
I was brought into the team because of my expertise in creating new tools.
I started by familiarizing with the Analyst’s tasks, surrounded by consistent communications with team’s of Analysts, developers, managers and very seasoned users of the current tools
While interviewing Analysts, and learn about the process, I documented by observing their work, methodologies behind their decisions when scoring.
Part of learning was to keep track of these teaching moments, while documenting their pain-points and wish lists, duplications, product capabilities, gathering requirements
Then I went on to propose a method of iteratively construct the new scorecard, while consistently communicating iterations and evaluating with all teams along the way.
All while comparing and connecting analysts in different but similar interests, and visualize and sketch out when needed, possible scenarios and solutions. Wire-framing, prototyping and designing score card applications, while following Design Thinking principles and following new and existing design trends.
Outcome:
A series of scorecards within an ecosystem that informs each other, which was named The Analytical Hub. (which hosts The Quantitative Workbench and The ESG & Climate Risk HUB/s among others)
While in the process of the creation of this Analytical hub, the need to designing patterns and system to speed the process of design, became a new Ui Pattern Library using Figma - a tool that I brought into the team - I used the back end developers, and saw the need to train them or at least guide them on what to learn for empower them to be able to apply the designs into a front end structure that would facilitate the design and implementation of the design.


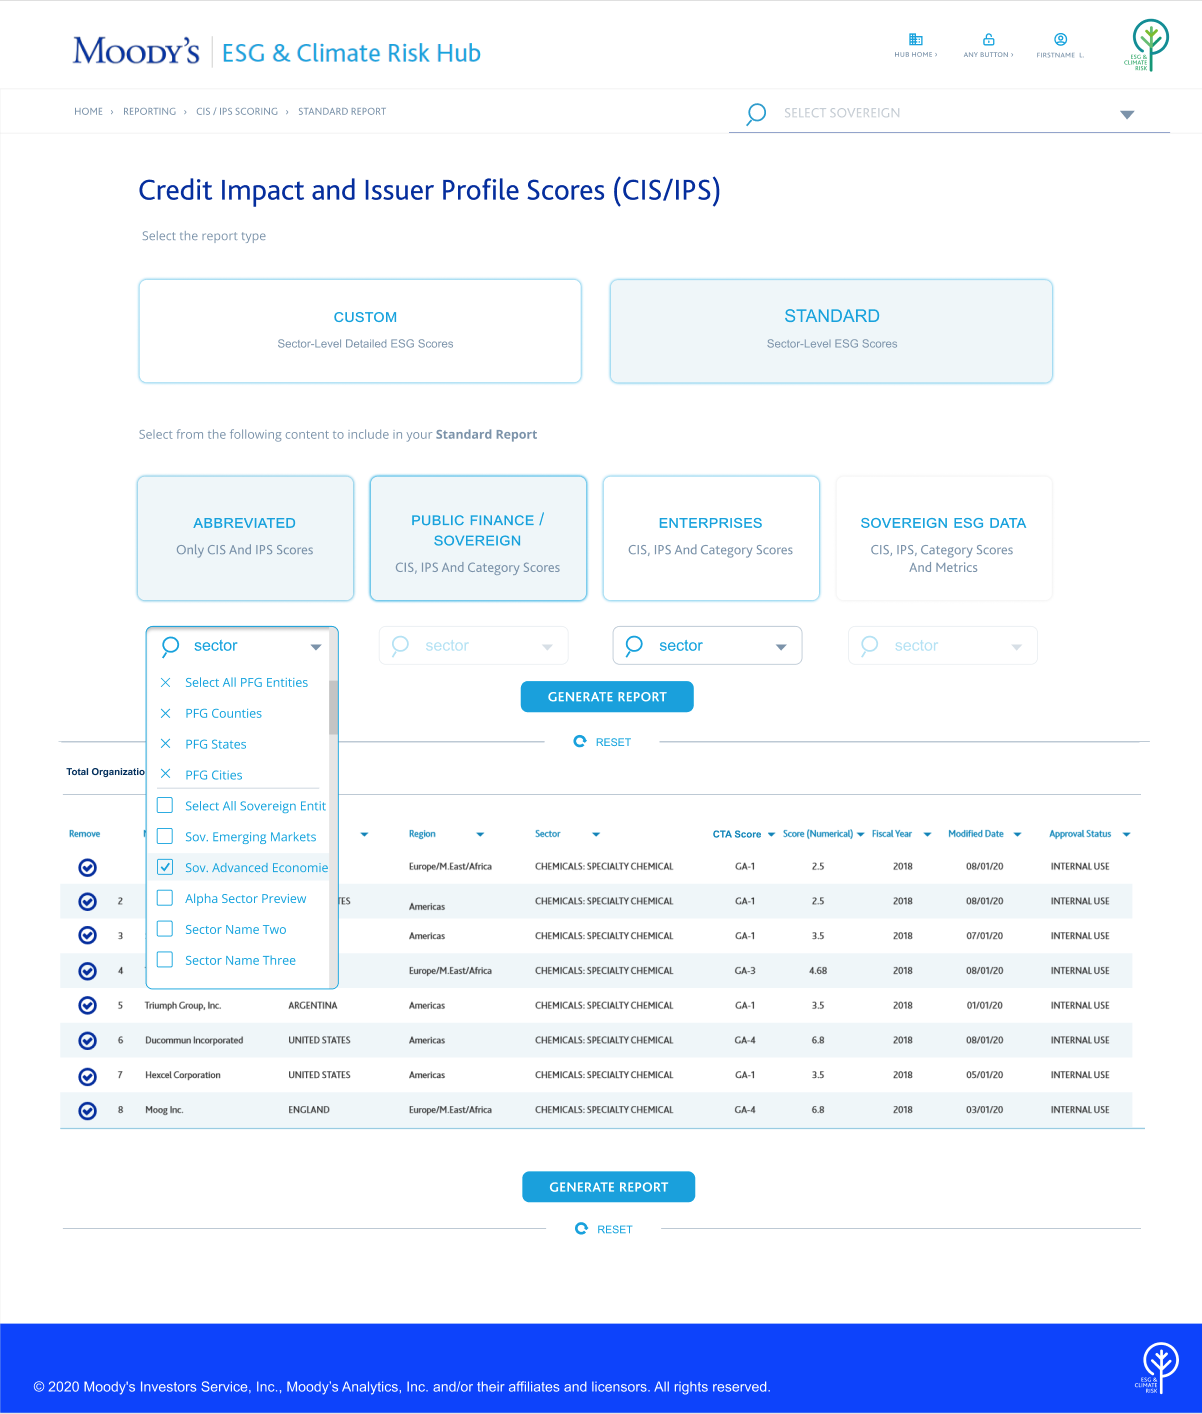
Dashboard sample - ESG and climate insights application.
User Journey
Single customizator

Data Heatmap Visualization